Unlock the secrets of successful trading in 2026 by learning how to confidently interpret trade charts. Whether you are a beginner or a seasoned trader, mastering chart analysis gives you a powerful edge in fast-moving markets.
This comprehensive guide will show you how to analyze, understand, and act on trade charts with clarity. You will explore essential chart types, recognize key patterns, use technical indicators, and apply step-by-step analysis for smarter decisions.
Ready to improve your trading results? Dive in and discover the strategies, tools, and insights that can help you achieve chart-reading mastery this year.
The Fundamentals of Trade Charts
Understanding trade charts is essential for anyone wanting to navigate financial markets with confidence. At their core, trade charts are graphical representations of an asset’s price movement over specific time intervals. They translate raw market data into visual form, making it easier to spot trends, patterns, and potential trading opportunities.
There are several types of trade charts, each offering unique insights. The most common are line charts, bar charts, and candlestick charts. Line charts connect closing prices over time, providing a simple view of general direction. Bar charts display the open, high, low, and close for each period, revealing more detail about each trading session. Candlestick charts, favored by many modern traders, use colored bodies and wicks to highlight the relationship between opening and closing prices, as well as market sentiment shifts.
| Chart Type | Visualizes | Best For |
|---|---|---|
| Line Chart | Closing prices | Quick trend overview |
| Bar Chart | OHLC (open, high, low, close) | Session detail |
| Candlestick | OHLC + color coding | Pattern analysis |
The timeframe selected on trade charts can dramatically alter the analysis. Intraday charts (such as 1-minute or 5-minute) are vital for day traders, who need to make quick decisions based on short-term price movements. Daily, weekly, and monthly charts are better suited for swing traders and long-term investors, offering a broader perspective on market direction. The choice of timeframe should align with your trading strategy and the asset being analyzed.
Every trade chart, regardless of style, includes several core components:
- Price axis: Shows the value of the asset.
- Time axis: Displays the period covered.
- Volume bars: Reflect the number of shares or contracts traded.
- Overlays and indicators: Tools like moving averages or Bollinger Bands add extra layers of analysis.
Trade charts play a vital role in day trading, swing trading, and even long-term investing. Day traders rely on rapid chart interpretations to capitalize on minute price changes, while swing traders look for patterns over days or weeks. Long-term investors may use charts to confirm entry or exit points within larger market cycles. Unlike fundamental analysis, which focuses on company earnings or macroeconomic data, trade chart analysis is entirely visual and data-driven.
For example, comparing a candlestick chart to a line chart of the S&P 500 for Q1 2026 reveals the candlestick’s ability to expose subtle price reversals and intraday volatility that a line chart would miss. This granularity can make the difference between catching a trend early and missing an opportunity.
It is important to note that over 85 percent of active traders use trade charts as a primary tool for making trade decisions, according to recent industry surveys. For those seeking to deepen their understanding, resources like trading education and chart analysis can be invaluable in mastering these skills.
Trade charts are not just pictures; they are the foundation of informed trading decisions. By learning to read and interpret trade charts, you unlock a new level of market insight and strategic advantage.
Essential Chart Patterns and What They Signal
Understanding essential chart patterns is a cornerstone of mastering trade charts. Patterns are the visual footprints of market psychology, revealing the ongoing battle between buyers and sellers. In 2026, recognizing these signals remains vital for traders seeking to anticipate price movements and make informed decisions.
Classic Patterns Every Trader Should Know
Classic chart patterns act as a trader’s roadmap, offering insights into potential price direction on trade charts. These patterns generally fall into two categories: reversal and continuation.
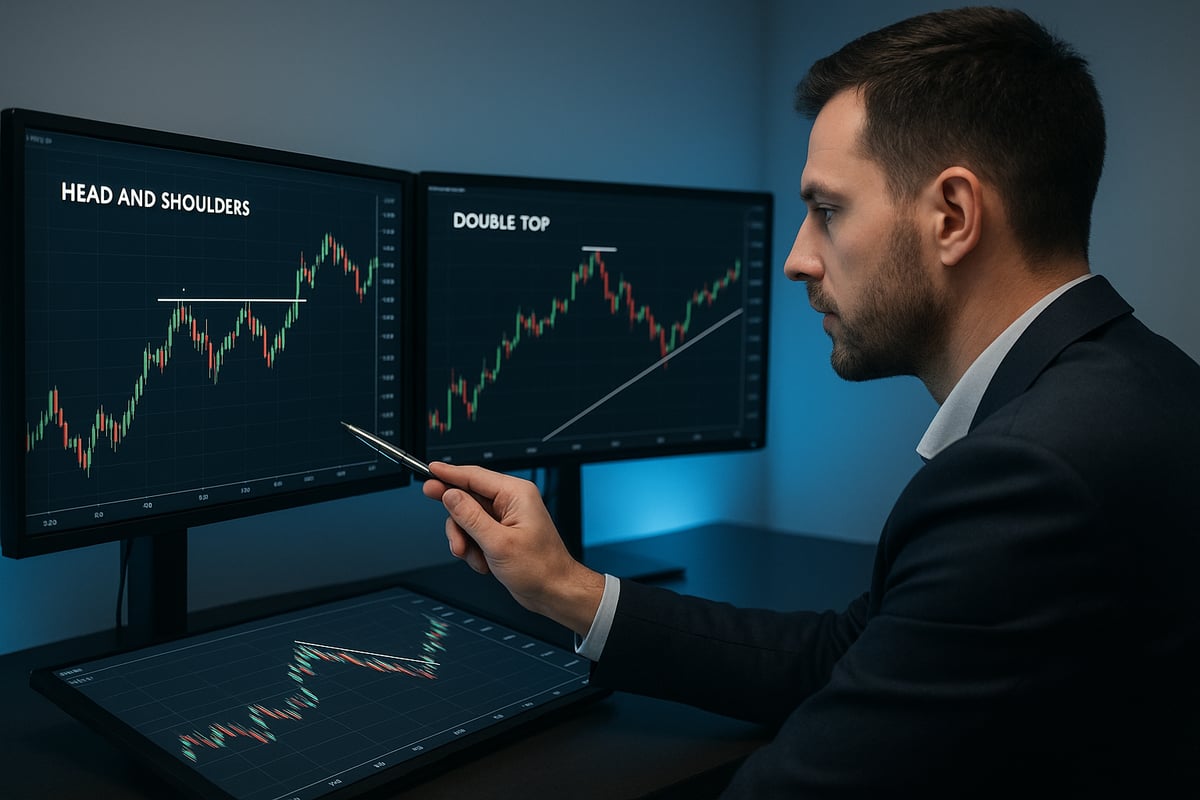
Reversal patterns, such as the head and shoulders and double tops or bottoms, signal that the existing trend may be coming to an end. For example, a head and shoulders pattern often appears at the peak of an uptrend on trade charts, indicating a shift from bullish to bearish sentiment. Traders look for a left shoulder, a higher head, and a right shoulder, with a break below the neckline confirming the reversal.
Continuation patterns like flags, pennants, and triangles suggest that the prevailing trend is likely to persist. Flags and pennants typically follow sharp price moves, with trade charts showing a brief consolidation before the trend resumes. Triangles form as price action narrows, and a breakout often signals the next directional move.
Breakout and breakdown signals are critical in trade charts. A breakout occurs when price moves above a resistance level or pattern boundary, while a breakdown happens below support. Confirming these moves with volume analysis is crucial. For instance, in early 2026, several tech stocks displayed a head and shoulders pattern on their trade charts. As the pattern completed and volume surged on the neckline break, it provided traders with a high-confidence reversal cue.
Volume acts as a key validator for chart patterns. Without strong volume, breakouts and breakdowns on trade charts are more likely to fail. Recognizing these classic patterns, especially in the context of broader market shifts like those seen in the 10 Trends Shaping Global Trade in 2026, helps traders stay ahead of market sentiment.
Support, Resistance, and Trendlines Explained
Support and resistance are foundational concepts in trade charts. Support represents a price level where buying interest appears strong enough to prevent further declines. Resistance is the opposite, where selling pressure blocks upward movement.
Drawing accurate trendlines helps traders visualize the direction of a trend on trade charts. Uptrend lines connect a series of higher lows, while downtrend lines link lower highs. When prices break above resistance or below support, it often signals a significant change in market dynamics.
Retracements and pullbacks are frequent on trade charts. A retracement is a temporary reversal within a trend, while a pullback is a short-term dip before the trend resumes. Distinguishing these from true trend reversals requires careful analysis of volume and price action.
Consider the EUR/USD currency pair during volatile 2026 conditions. As prices tested a well-established support level on the trade charts, buyers consistently stepped in, preventing a breakdown. This scenario illustrates how support can hold even in turbulent markets.
Traders sometimes make mistakes such as drawing trendlines through price spikes or trusting weak support levels based on limited data. To avoid errors, always use multiple points for drawing lines and validate support or resistance with historical price action on trade charts.
Mastering these techniques allows traders to interpret trade charts with greater confidence, ensuring that support, resistance, and trendlines become powerful tools in their trading arsenal.
Technical Indicators: Tools for Deeper Chart Analysis
Technical indicators are the backbone of modern trade charts, offering traders a systematic way to interpret price movements and market dynamics. By leveraging these tools, traders can gain deeper insights, spot potential opportunities, and manage risk more effectively. Mastery of technical indicators is essential for anyone aiming to excel in the fast-paced world of trade charts.
Leading vs. Lagging Indicators
Understanding the distinction between leading and lagging indicators is crucial for interpreting trade charts. Leading indicators aim to forecast future price moves by providing early signals of potential market direction. Lagging indicators, in contrast, confirm trends after they have begun, helping traders validate their strategies.
Below is a comparison table to clarify the differences:
| Feature | Leading Indicators | Lagging Indicators |
|---|---|---|
| Purpose | Predict future moves | Confirm existing trends |
| Timing | Early signals | After-the-fact signals |
| Example | RSI, Stochastic | Moving Averages, MACD |
| Best for | Entry/exit timing | Trend confirmation |
For example, the Relative Strength Index (RSI) is a leading indicator that helps anticipate overbought or oversold conditions. Moving averages, such as the Simple Moving Average (SMA), are lagging indicators that smooth out price data to reveal the overall trend.
Traders often choose leading indicators when they want to act on trade charts proactively, while lagging indicators are preferred for confirming trends before making decisions. Combining both types can provide a balanced approach to chart analysis, especially in volatile markets where timing is critical.
Most Popular Indicators and Their Applications
A variety of technical indicators are available to enhance your analysis of trade charts. Each serves a unique purpose and can be tailored to fit different trading styles. The most widely used indicators include:
- Moving Averages (SMA, EMA): Smooth price data to identify trends. The Exponential Moving Average (EMA) reacts more quickly to recent price changes, making it suitable for active traders.
- Relative Strength Index (RSI): Measures momentum and identifies overbought or oversold conditions, signaling potential reversals.
- MACD (Moving Average Convergence Divergence): Combines trend and momentum analysis, highlighting shifts in market direction. For instance, a bullish MACD crossover in commodities can signal a strong buying opportunity.
- Bollinger Bands: Display volatility bands above and below a moving average, helping traders spot breakouts or periods of consolidation.
Choosing the right indicators depends on your goals and the assets you trade. For example, a swing trader may rely on EMA crossovers and RSI for timing entries and exits, while a day trader might use Bollinger Bands to gauge volatility in fast-moving markets.
Access to robust trading tools is essential for applying these indicators effectively. Explore Top trading tools and resources to discover platforms and software that make analyzing trade charts more efficient and customizable.
Combining Indicators for Stronger Signals
Relying on a single indicator can lead to misleading signals. Savvy traders use the concept of confluence, which means combining multiple indicators to increase the reliability of trade chart analysis.
For instance, pairing RSI with moving averages can filter out false signals and highlight high-probability setups. By waiting for both indicators to align, traders improve their chances of success.
However, it is important to avoid indicator overload. Using too many tools can create confusion and conflicting signals. Focus on a few well-understood indicators that complement each other.
Consider this approach:
- Select two or three indicators that suit your trading style.
- Look for agreement among them before entering a trade.
- Regularly review your indicator choices and adjust based on your results.
This disciplined method helps ensure that trade charts provide clear, actionable information, supporting consistent decision-making in any market environment.
Step-by-Step Guide to Reading and Analyzing Trade Charts
Mastering trade charts requires a systematic approach that breaks down complex information into actionable steps. By following this guide, you will build a strong foundation for confident, data-driven trading decisions. Each step below is designed to help you interpret and act on what you see in trade charts, no matter your experience level.
Step 1: Selecting the Right Chart Type and Timeframe
The first step in analyzing trade charts is choosing the chart type that best fits your trading goals. Line charts offer a simple overview, while candlestick and bar charts provide deeper insight into price action and market psychology.
Next, select a timeframe that matches your strategy. Scalpers may rely on 1-minute or 5-minute charts, while swing traders often use daily or weekly views. For example, futures traders prefer short-term charts, whereas stock investors might analyze daily or monthly charts for broader trends.
Modern platforms like TradingView charting platform insights offer extensive customization, enabling you to tailor trade charts to your needs. Always match the chart type and timeframe to your asset class and preferred trading style for optimal clarity.
Step 2: Identifying the Market Trend
With the right trade charts set up, the next step is to determine the prevailing market trend. Trends can be upward, downward, or sideways, and each requires a different approach.
To spot an uptrend, look for a series of higher highs and higher lows. Downtrends are characterized by lower highs and lower lows, while sideways markets show minimal movement between support and resistance.
Use moving averages and trendlines to confirm your observations. For example, a trend reversal in the Nasdaq index may be identified when the price crosses above a key moving average, signaling a shift in momentum.
Step 3: Spotting Key Patterns and Levels
Trade charts are rich with patterns that can signal potential trading opportunities. Scan for classic formations such as head and shoulders, double tops and bottoms, or triangles. These patterns often indicate shifts in market sentiment.
Support and resistance levels are crucial markers on trade charts. Mark these zones to plan your entry and exit points. For example, a double bottom pattern in the energy sector can act as a buy signal, especially if the price rebounds from a strong support area.
Always use patterns and levels together to improve the reliability of your analysis.
Step 4: Applying Technical Indicators
Technical indicators add another layer of insight to trade charts. Choose indicators that align with current market conditions and your trading objectives.
Popular options include the Relative Strength Index (RSI) for spotting overbought or oversold conditions, and moving averages to gauge trend direction. Adjust parameters to suit your market, such as fine-tuning RSI settings for highly volatile crypto assets.
Well-chosen indicators help filter out noise and highlight actionable signals on your trade charts.
Step 5: Confirming Signals and Planning Trades
Before executing any trade, confirm your signals using multiple tools. Volume analysis, indicator confluence, and price action are all vital for increasing confidence in your decisions.
For example, combining MACD with a breakout above a support level on trade charts can provide a strong entry signal. Plan your trade by setting clear entry points, stop-loss levels, and profit targets.
This disciplined approach helps reduce risk and improves your overall trading outcomes.
Step 6: Reviewing and Refining Your Chart Analysis Process
Consistent success with trade charts depends on ongoing review and refinement. Keep a detailed trading journal to track your decisions, outcomes, and the accuracy of your analysis.
Regularly revisit past trades to identify mistakes, such as misinterpreting patterns or ignoring key signals. For instance, analyzing losing trades may reveal a tendency to overlook confirmation indicators.
By learning from your own data, you will steadily improve your ability to read and act on trade charts with confidence.
Advanced Chart Analysis Strategies for 2026
Modern traders face increasingly complex markets, where mastering advanced strategies for analyzing trade charts is essential. In 2026, new tools and methodologies have emerged, giving traders deeper insights and a competitive edge. Let’s explore three critical techniques shaping the future of chart analysis.
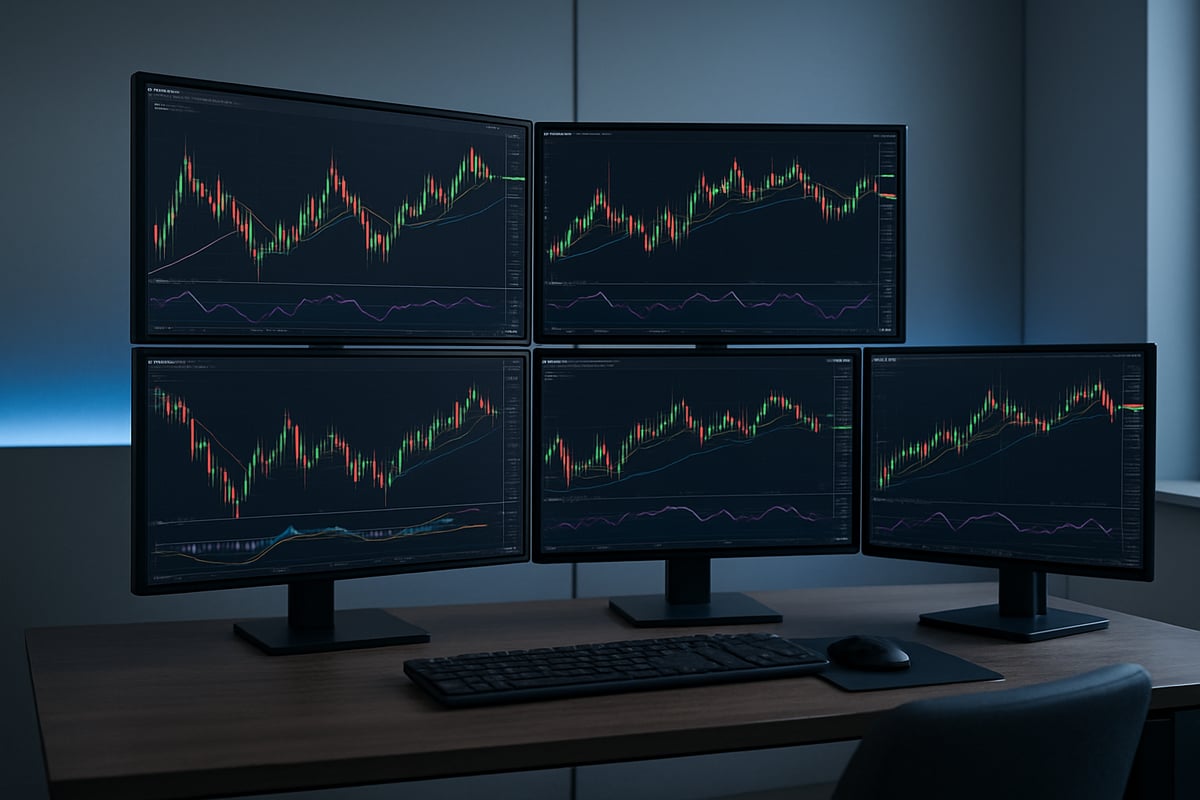
Multi-Timeframe Analysis: Seeing the Bigger Picture
One of the most effective ways to analyze trade charts is by using multi-timeframe analysis. This strategy involves examining the same asset across different timeframes, such as daily, weekly, and monthly charts. By doing so, traders can gain a clearer understanding of the overall market trend and avoid false signals that appear in isolation.
For example, a trader might spot a bullish breakout on a daily chart, but confirm its validity by ensuring the weekly chart also supports an uptrend. This alignment increases confidence in the trade decision and reduces the risk of acting on short-term noise.
Key benefits of multi-timeframe analysis include:
- Identifying major support and resistance zones across timeframes
- Filtering out misleading signals from lower timeframes
- Improving timing for entries and exits
By consistently applying this approach to trade charts, traders can enhance their ability to anticipate market moves and make more informed decisions.
Volume Profile and Order Flow Tools
Understanding the flow of capital in trade charts requires more than just watching price movements. Volume profile analysis provides a visual representation of traded volume at specific price levels, revealing where buyers and sellers are most active. This helps traders identify high-interest zones and potential reversal points.
Order flow tools, such as reading the tape or monitoring the depth of market (DOM), offer a granular view of real-time transactions. By observing volume spikes or sudden changes in order book dynamics, traders can anticipate shifts in market sentiment before they appear in traditional indicators.
Consider the following ways to apply volume and order flow tools:
- Spotting accumulation or distribution phases
- Detecting volume spikes that precede trend reversals
- Confirming breakouts with increased trading activity
Integrating these techniques with other trade charts strategies allows for a more nuanced view of market structure and enhances the reliability of trade setups.
Algorithmic and AI-Driven Chart Analysis
In 2026, algorithmic and AI-driven platforms are transforming how traders interpret trade charts. These tools automatically scan vast amounts of market data, recognizing patterns and generating actionable alerts faster than any human could. As a result, traders can react to opportunities more efficiently and consistently.
AI-powered charting tools excel at detecting subtle formations, analyzing historical data, and adapting to changing market conditions. However, while they offer impressive speed and accuracy, they are not infallible. Traders should still validate AI-generated signals with their own analysis and risk management strategies.
For context, over 40% of retail traders now use AI-powered charting platforms, reflecting a major shift in the industry. Staying updated on the latest 2026 Outlook for the Economy and Markets can help traders align their chart analysis with broader economic trends and make smarter decisions.
Incorporating algorithmic tools into your trade charts workflow can streamline analysis, but human oversight remains crucial. The best results come from blending automation with critical thinking and experience.
Top Charting Platforms and Tools for Modern Traders
Navigating the fast-paced world of modern trading requires powerful charting platforms. The right tools are essential for interpreting trade charts with accuracy and speed. As technology advances, platforms evolve to offer deeper analysis, seamless integration, and real-time insights, making them indispensable for traders at every level.
Leading Charting Platforms Overview
Several platforms dominate the trade charts landscape in 2026. TradingView stands out for its user-friendly interface, extensive indicator library, and vibrant social community. MetaTrader remains a favorite among forex and CFD traders, known for its robust scripting and automated trading capabilities.
Thinkorswim, powered by TD Ameritrade, is popular for its advanced analytics and customizable layouts. Other notable tools include NinjaTrader, designed for futures and active traders, and MultiCharts, which appeals to those seeking deep strategy testing. The diversity of these platforms ensures that every trading style, from day trading to long-term investing, can find a suitable match.
Key Features and Platform Comparison
When evaluating trade charts platforms, traders should prioritize features that support their strategies. Key aspects include real-time data, customizable indicators, mobile access, and integration with brokerage accounts. The following table summarizes core features across leading platforms:
| Platform | Real-time Data | Custom Indicators | Mobile Access | Social Features | Broker Integration |
|---|---|---|---|---|---|
| TradingView | Yes | Yes | Yes | Yes | Partial |
| MetaTrader | Yes | Yes | Yes | No | Full |
| Thinkorswim | Yes | Yes | Yes | Limited | Full |
| NinjaTrader | Yes | Yes | No | No | Full |
As digital innovation reshapes the market, traders increasingly rely on platforms that harness big data and AI. For more on how digital competitiveness impacts trade charts, see Forecasting ICT-Driven Trade Competitiveness 2024-2028.
Integration, Security, and Support
A top priority for modern traders is seamless integration with brokers and trading platforms. This ensures that trade charts not only inform decisions but also connect directly to order execution. Security is equally vital, with platforms offering encryption and regular updates to protect sensitive data.
Pricing varies: TradingView offers free and premium tiers, MetaTrader is often free through brokers, while Thinkorswim is available to TD Ameritrade clients. Responsive customer support is crucial, especially for troubleshooting technical issues or learning new features.
Example: Social Features in Action and Choosing the Right Platform
Consider a trader using TradingView’s social features to share trade charts and insights with a global community. This collaboration fosters idea generation and helps refine chart analysis skills. Ultimately, the best platform aligns with your trading style, asset focus, and need for customization. Evaluate trial versions and feature lists to find the ideal fit for your trading journey.
Practical Tips and Best Practices for Consistent Chart Analysis
Mastering trade charts requires more than memorizing patterns or indicators. Success comes from developing consistent habits, using structured routines, and staying adaptable in the ever-changing world of trading.
Building a Daily Chart Analysis Routine
Establishing a daily routine is essential for reliable trade charts analysis. Start each session by scanning major markets and reviewing previous setups. Mark support, resistance, and trendlines, then note any patterns forming.
List essential steps:
- Review open positions and recent trades.
- Analyze top watchlist assets using your preferred chart types.
- Update chart notes and adjust key levels as needed.
A structured approach helps you spot opportunities and avoid impulsive decisions. Consistency builds confidence and improves your ability to interpret trade charts over time.
Avoiding Common Pitfalls and Managing Risk
Many traders struggle with overtrading, relying on too many indicators, or letting emotions drive decisions. To minimize these risks, limit the number of indicators on your charts and use clear entry and exit rules.
Risk management is crucial for sustainable success. Integrate stop-loss and position sizing rules into your chart analysis. For more strategies on protecting your capital, explore Risk management in trading.
Common mistakes include ignoring volume confirmations, failing to journal trades, and chasing trends without a clear plan. Stay disciplined by reviewing your actions regularly and refining your process.
Adapting to New Tools and Continuous Learning
The landscape for trade charts is always evolving. Stay current by exploring new charting platforms, indicator libraries, and analysis features. Attend webinars, join trading communities, and take courses to sharpen your skills.
Learning from others accelerates your growth. Engage in idea sharing and discussions to test your analysis methods. Adapting to the latest tools ensures you remain competitive in the fast-moving trading world.
The Power of Discipline and Review
Anecdotal evidence shows that traders who commit to disciplined chart review routines have improved their win rates by as much as 15 percent. Keeping a detailed journal of your trade charts analysis lets you identify errors and adjust strategies.
According to industry data, traders who regularly review and journal their charts outperform their peers by an average of 10 percent. Consistency, discipline, and a willingness to learn are the keys to mastering trade charts and achieving long-term trading success.
Now that you’ve explored the essential trade chart patterns, technical indicators, and practical steps to refine your analysis, you’re ready to elevate your trading discipline and decision making in 2026. Imagine the progress you’ll make by tracking your trades with a structured journal, rating your execution, and building your own A Plus Setup Playbook for consistent results. If you’re serious about mastering your approach, beyond just seeking profits, let’s take the next step together.
Get Started
You might also like
Discover why tracking your rule-following and discipline beats obsessing over P&L, and how a simple 1-5 star rating…
Unlock your trading potential in 2026 by harnessing the power of my trading journal. Most traders do not…